Four weeks ago we launched the first OpenBind Blind Challenge with OpenADMET and the ASAP Discovery Consortium, focusing on the Zika virus NS2B-NS3 protease. We have now reached the interim checkpoint, and today we are sharing the first results on the full set of 400 structures.
First, a big thank you to all participants! So far, 45 participants have submitted predictions, and competition at the top of the leaderboard is fierce.
Until now, the live leaderboard has only shown results for half of the complexes. We deliberately held back the other half to assess how well methods generalise and discourage overfitting to the public leaderboard. The interim leaderboard evaluates predictions on all 400 structures, providing the most complete picture of current performance. You can browse the full set of interim results on the Hugging Face space.
Leaders and contenders
To assess whether differences between entries are statistically significant, we use paired bootstrap comparisons with Holm-Bonferroni correction (see Peak Performance or Just Noise?). Figure 1 shows the full ranking, including our five baselines, organised into simplified significance tiers. We derive these tiers from the significance groups on the interim leaderboard, where entries share a group when no statistically significant difference is detected between them. Working down the ranking, the highest-ranked entry not yet placed starts a new tier, and every following entry that shares a group with it joins that tier. Because each tier is anchored on its top entry, entries near a tier boundary may still be statistically indistinguishable from entries in the next tier.
The current first-place entry achieves a success rate of 81.25% (325/400 complexes) and stands alone in Tier 1, with a statistically significant lead over the rest of the field. The next six entries, with success rates between 72.5% and 77%, form Tier 2. Further down the leaderboard, neighbouring tiers overlap considerably more, as differences of just a few percentage points are often not statistically significant. While the complete significance groups are available on the Hugging Face interim leaderboard, the tiers shown here provide a useful summary of the results.
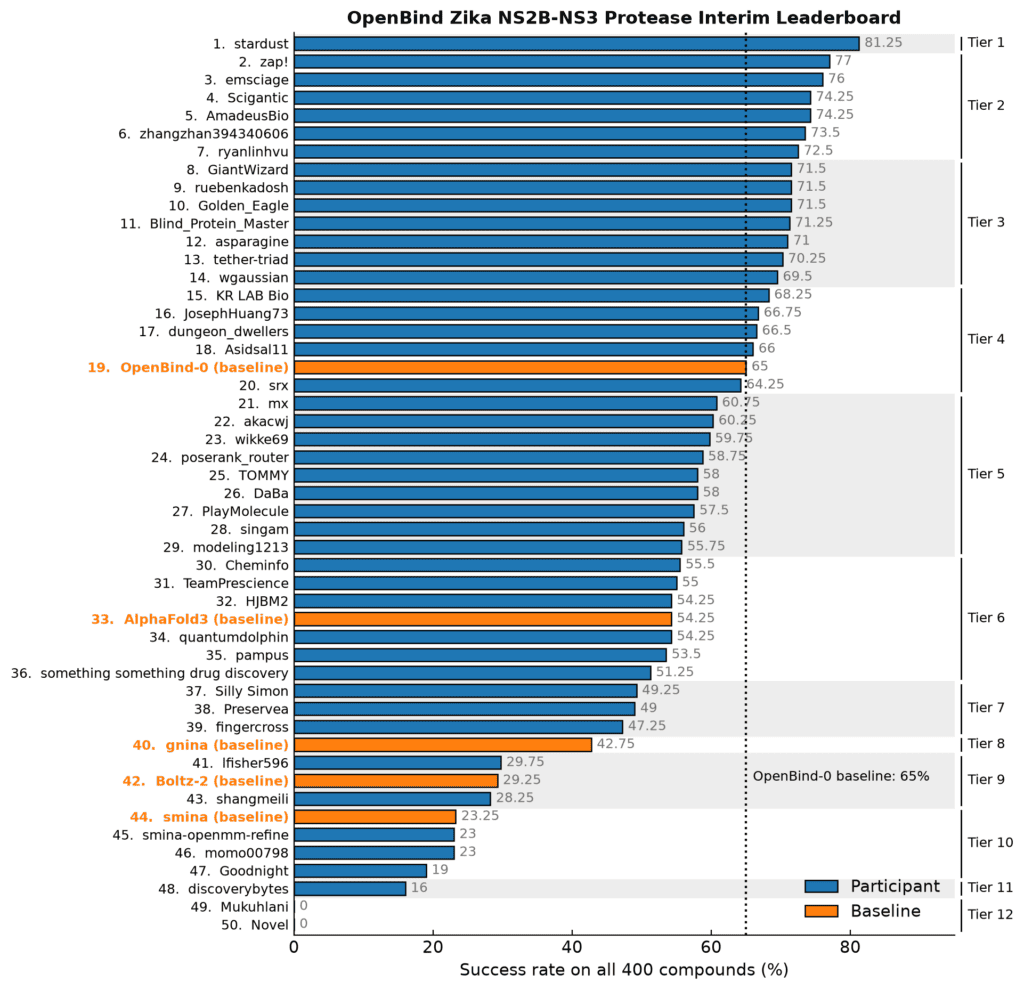
Eighteen of the 45 participants outperform OpenBind-0, our strongest baseline (65.0% success rate), with fourteen showing a statistically significant improvement. Community submissions also outperform the other baselines: 30 participants achieve higher success rates than AlphaFold3, while the vast majority outperform gnina, Boltz-2, and smina. None of the participants reported using proprietary data, highlighting the strong performance achievable with publicly available data and resources.
Breaking down the success rate
For this OpenBind Blind Challenge, a prediction counts as successful only if it passes three criteria:
- BiSyRMSD < 1.5 Å: the predicted ligand sits within 1.5 Å of the experimental pose, after aligning the binding site and accounting for ligand symmetry.
- lDDT-PLI > 0.8: the protein–ligand contacts closely match those in the experimental structure.
- PoseBusters valid: the pose passes checks for chemical and structural plausibility, including clashes, molecular geometry and stereochemistry.
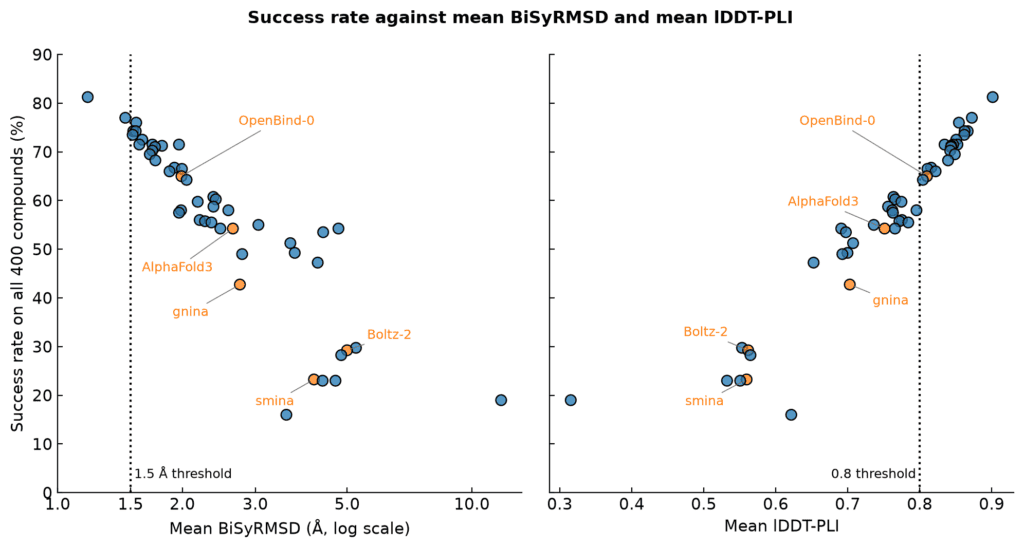
That makes the success rate a strict, all-or-nothing score: a pose that narrowly misses a threshold counts the same as one that is far off. Mean BiSyRMSD and mean lDDT-PLI provide complementary information about overall pose quality that is lost when predictions are reduced to a binary success or failure. However, this also makes success rate less sensitive to outliers: a ligand predicted in a completely different binding pocket counts as a single failure, whereas such a large positional error can disproportionately affect mean BiSyRMSD.
The three measures are broadly correlated (Figure 2): entries with higher success rates generally have lower mean BiSyRMSD and higher mean lDDT-PLI. We found that only the two highest-ranked entries achieve a mean BiSyRMSD below the 1.5 Å threshold, at 1.18 Å and 1.46 Å, respectively. We also note that similar success rates can still hide different pose quality: three entries share a success rate of 71.5%, but their mean BiSyRMSD ranges from 1.57 to 1.96 Å. Three others tie at 54.25%, with BiSyRMSD means between 2.5 and 4.8 Å.
In short, success rate tells us how many predictions pass all three criteria, while mean BiSyRMSD and lDDT-PLI reveal differences in overall pose quality that the binary metric cannot capture. Together, they provide a more complete picture, balancing the robustness of a binary success metric against the additional detail offered by continuous measures.
Comparing performance with the held-out set
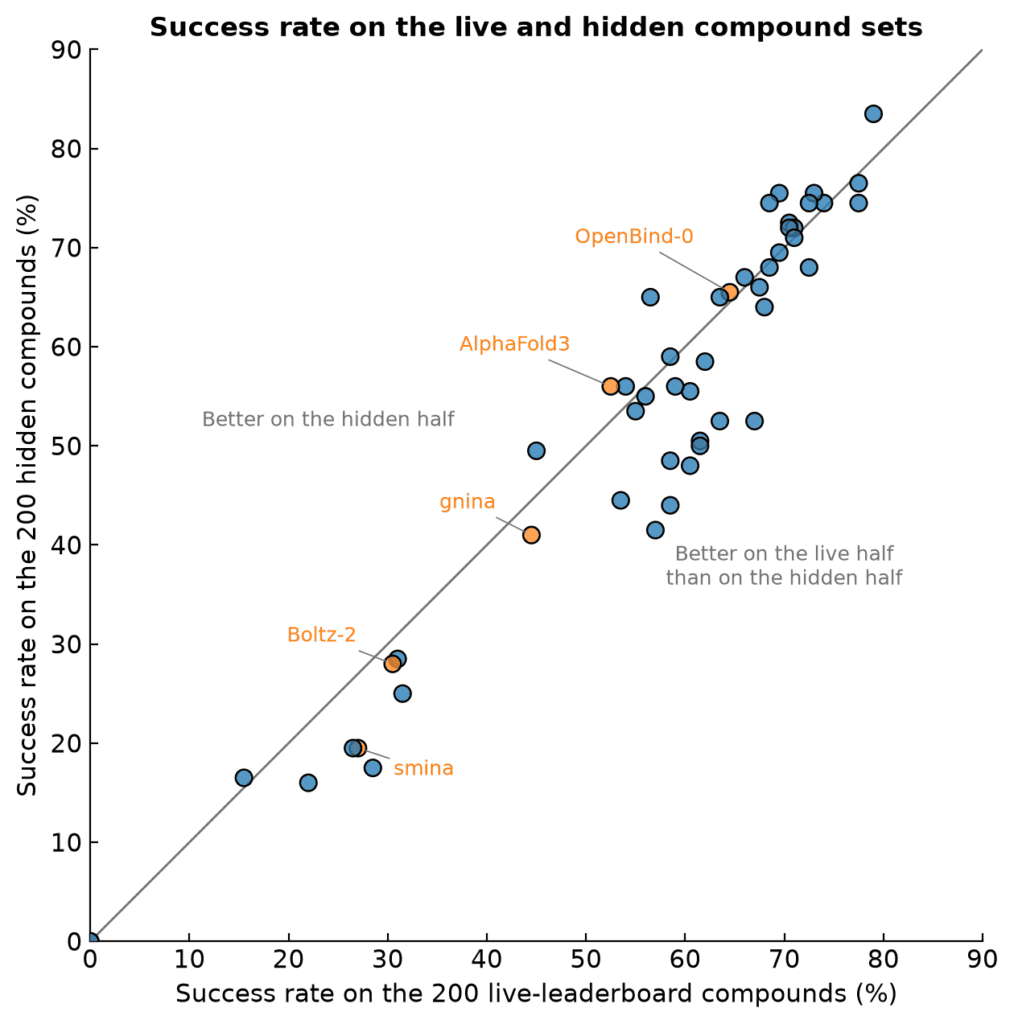
To assess how well performance on the live leaderboard carries over to the held-out set, we compared success rates across both splits (Figure 3). Rankings are broadly consistent, particularly among the leading entries. For the 20 highest-ranked entries, success rates differ by no more than six percentage points between the two halves, with 12 performing better on the held-out set. This suggests that the leading methods perform consistently across the two subsets of this challenge.
Further down the leaderboard, performance is less consistent between the two splits. Among entries ranked 21–39, most perform worse on the held-out set, with an average decrease of more than five percentage points. Nine of these 19 entries decline by at least nine percentage points.
Overall, these results suggest that performance on the live leaderboard is a reasonable indicator of performance on the full dataset, particularly for the leading entries. Nevertheless, the differences observed further down the rankings highlight the importance of evaluating methods on all 400 complexes, as reflected in the interim leaderboard.
Join us for the second half
The challenge remains open until 16 December 2026 at 23:59 UTC. With participants continuing to update and improve their submissions, there is still plenty of opportunity for the rankings to change.
It is not too late to join! Whether you run docking, co-folding or a mix of both, the tutorial repository has all the information you need, including evaluation scripts to check your predictions locally before submission. If you have already submitted before, you can use the interim leaderboard to judge where you stand. Please be reminded that:
- you can resubmit as often as you like (with at least 12 hours between submissions), and your latest submission is the one that counts
- predictions should cover all 400 complexes, since missing ones count as failures
- a short method report is required to appear on the final leaderboard
Questions and strategy talk are welcome in the #openbind-challenge channel on the OpenADMET Discord. We will look at what worked and why in the wrap-up after the challenge closes.
Good luck, and we look forward to seeing how the challenge develops!
Acknowledgements
We thank everyone who has submitted so far, and the experimental scientists and data wranglers at OpenBind who made this challenge possible. We thank our collaborators at the ASAP Discovery Consortium for the compounds from their hit-to-lead phase against Zika NS2B-NS3, many of which come from the medicinal chemistry campaign disclosed in this preprint, and for data generated under NIH NIAID Antiviral Drug Discovery (AViDD) grant U19AI171399.
We also thank the beamline staff of I03 and I04-1 at Diamond Light Source for collecting the data under proposal lb42888. OpenBind received funding from the UK Department of Science, Innovation and Technology under grant number G2-SCH-2025-06-16537. The OpenADMET team thanks Radial, part of the Astera Institute, for continuing support of our blind challenge efforts.